

You may get a situation while creating charts that some vertical bars of the chart have very low value than other vertical bars so that the bars having low value are almost invisible. In those situations you can enable Scale Breaks.
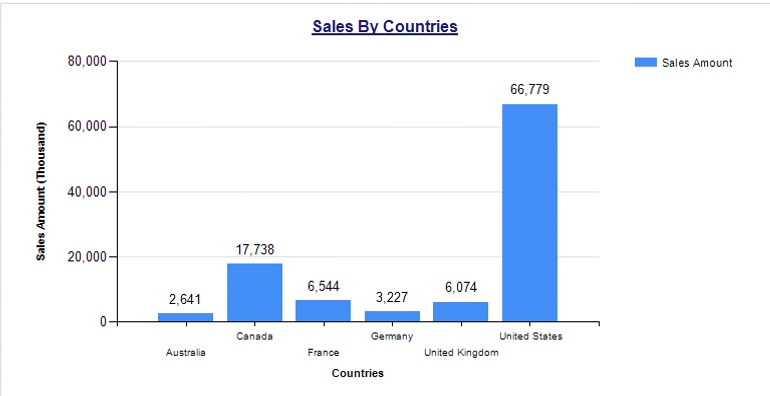
E.g. In the chart below Sales Amount of United States for a company is much higher as compared to other countries. The sales report is generated with respect to the highest sales. The blue bars of another countries like Germany and Australia is very low with respect to United States.
To make the lower bars visible , you can enable scale breaks. The steps to enable scale break are written below.
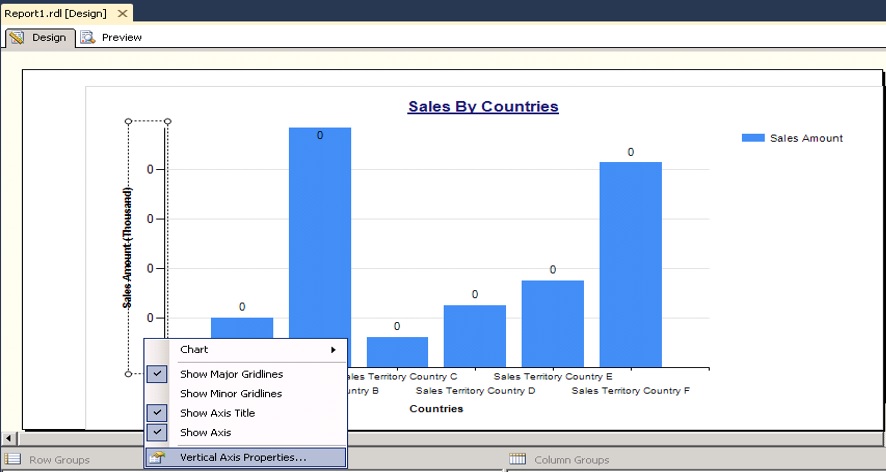
Go to design tab in BIDS/SSDT*.Select the vertical axis of the chart .Right click on it and go to Vertical Axis Properties as shown below.
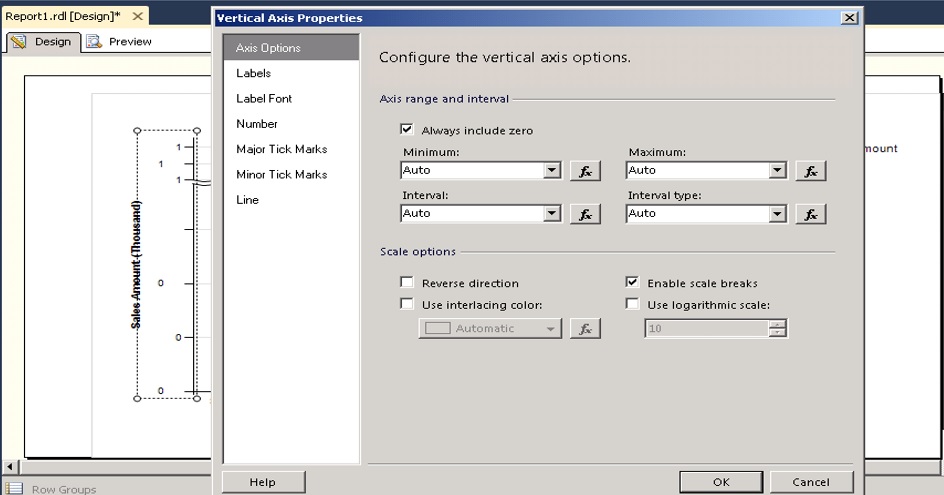
In the Axis Option section check Enable scale breaks and click ok button.
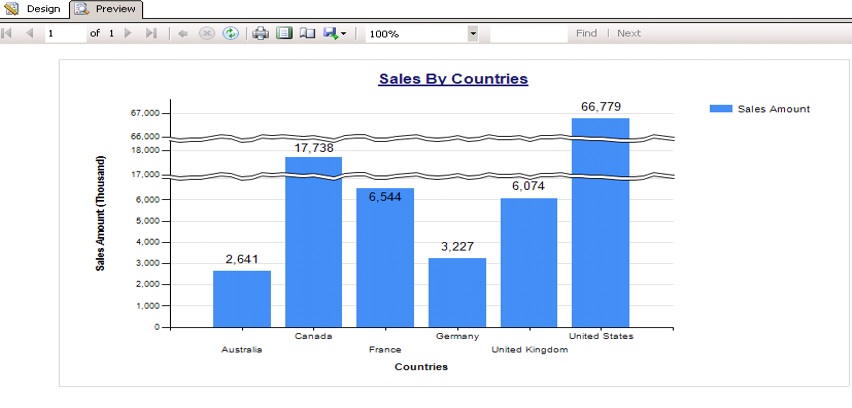
Click on the preview tab in BIDS/SSDT*.The two wave like lines in the figure below represents the vertical scale break.
The bars of Germany and Australia are very visible now as shown below.
*BIDS – Business Intelligence Development Studio .It is a Development tool used till SSRS 2008.
*SSDT– SQL Server Data Tools .From 2012 version and onwards name of BIDS has been changed to SSDT.