

Many developers create reports using SSRS by taking SSAS as source. SSRS is used to create Formal Reports where the pattern of the report is known in advance and it has fixed number of Measure and Dimension columns. You can’t add new dimension or measure in the existing report.
These days Self Service Reporting is getting popular in which the end user can connect to all the Measure and Dimension columns of the datasource and then end user can create the report on its own by choosing the desired Measure and Dimension columns.
Excel is one of the tools by which you can perform Self Service Reporting.In future excel popularity will increase more as a Business Intelligence Tool because of its many new add-ins like PowerPivot, PowerView and PowerQuery etc. I shall discuss this on some other day.
Please note Pivot Table option is different from PowerPivot Addin.
Here I am writing about the Pivot Table option available in excel.
Pivot Table is an option available in excel with which you can create interactive view of data from many different sources .These sources can be SSAS,SQL Server Databases and even excel sheets etc. You can group ,drill down and slice the data with it.
In this post I am discussing only about Pivot Table option and how to create Pivot Table in excel from SQL Server Analysis Services (SSAS).
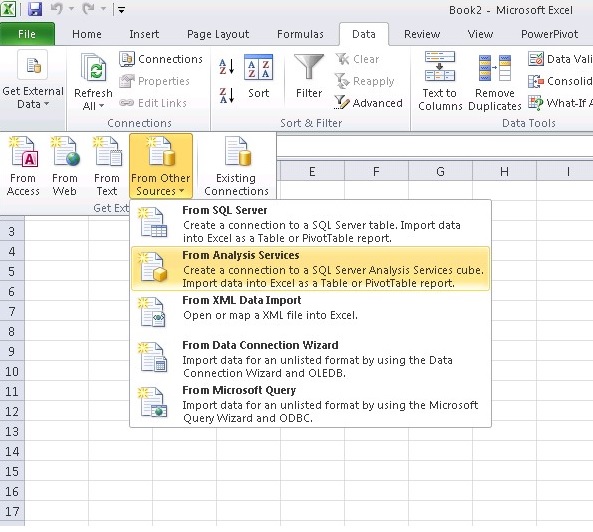
Open excel -> Go to Data->Get External Data->From other sources-> From Analysis Services
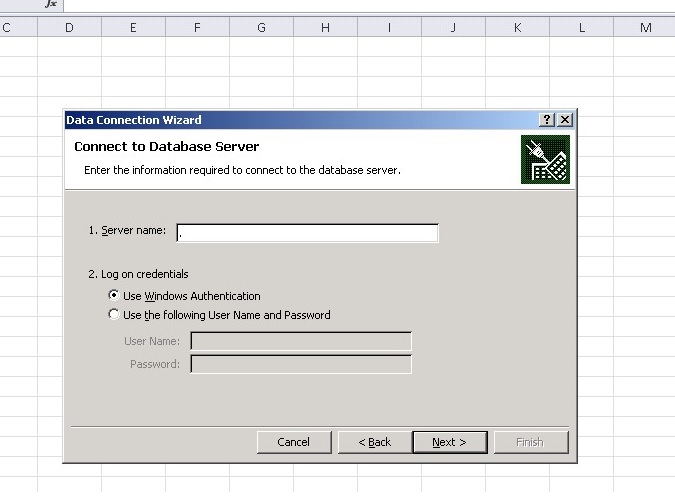
Connect to the Analysis Server. I am connecting to my local SSAS by writing server name as .(dot). Dot represents local SSAS. And Click Next
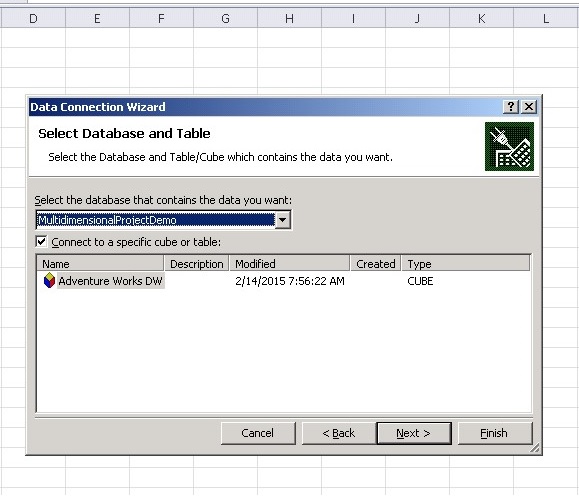
Choose the desired database from the dropdownlist and then select the cube under the option Connect to a specific cube or table and click Next and Finish.
Then it will ask you to create a Pivot Table . Choose the option existing worksheet and click the cell in the excel worksheet from where you want to generate the Pivot Table.
Want to Learn MDX in 10 US Dollars. Please click here to get discount coupon
E.g I have clicked on C4 cell and automatically the option for Existing worksheet has been changed to =Sheet1!$C$4 .
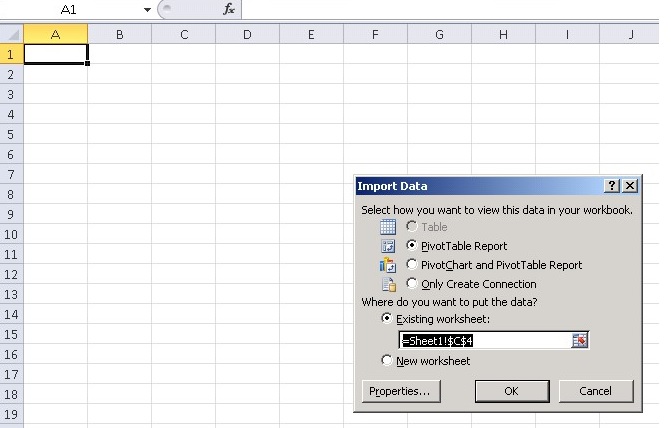
Click ok.
After that list of Dimensions and Measures will appear on Left Hand Side. You can drag and drop the dimensions on Row Labels and Column Labels and Measures into the Values section.
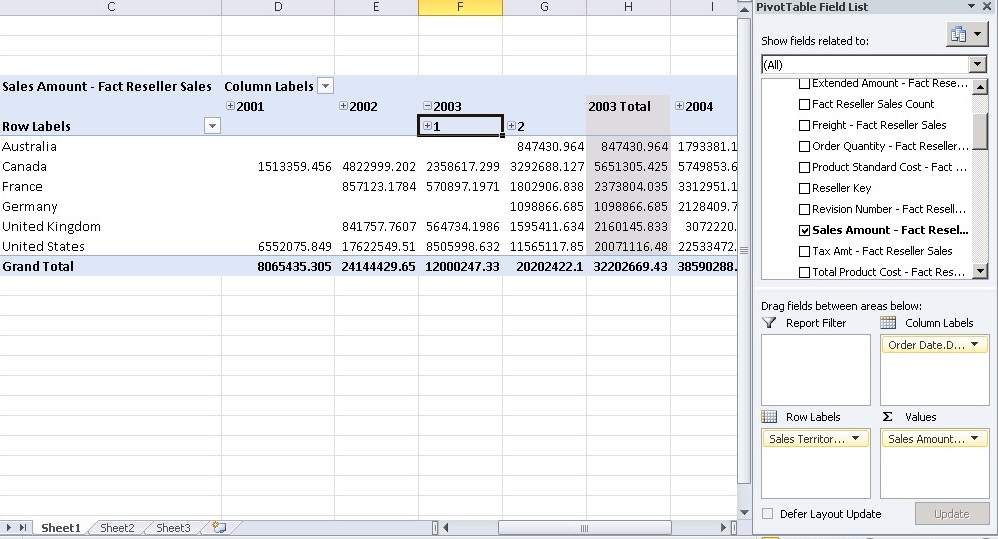
In the following figure , I drag and drop DateHierarchy into Column Labels and SalesTerritory into the Row Labels and Sales Amount into the Values Section.You can drill down DateHierarchy from Year-> Semester-> Quarter-> Month .It shows that Pivot Table supports drilldown operations.
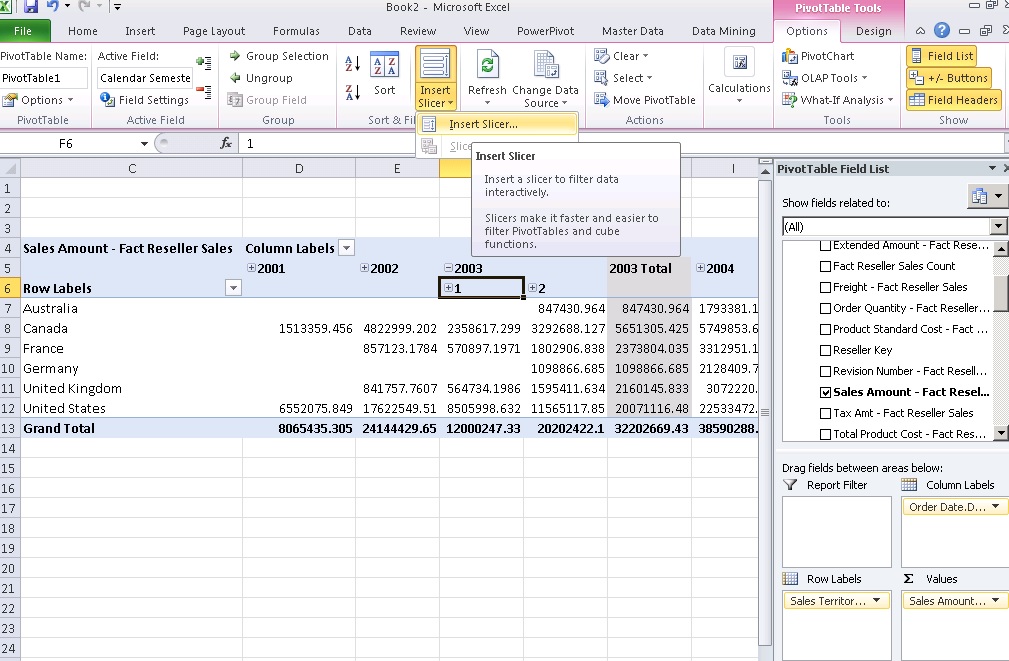
Also you can add slicers to filter the data.
Under Pivot Table Tools –> Choose Options-> Choose Insert Slicer-> Insert Slicer
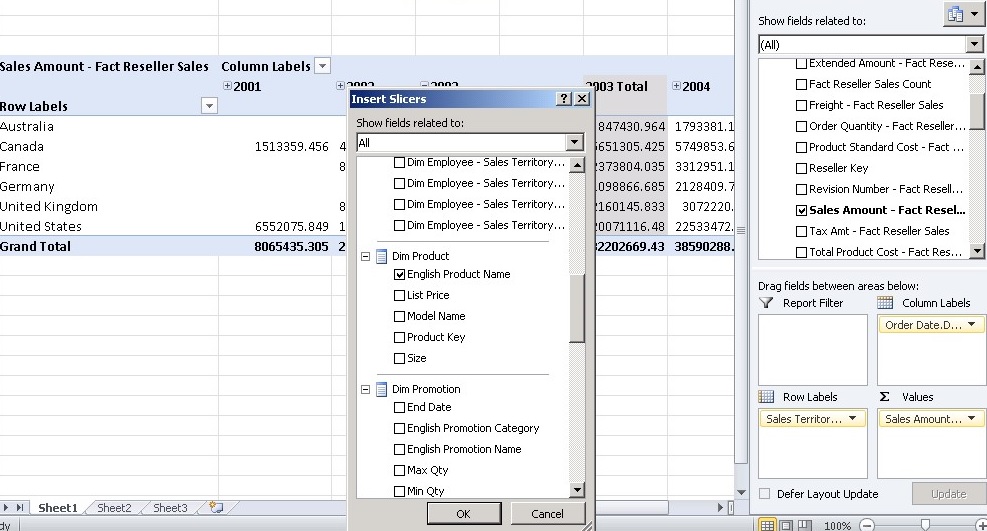
I have chosen English Product Name to Slice the data.
In the English Product Name slicer list, I have chosen Classic Vest,M and it is showing me the pivot table report only for that product. With the help of control key you can choose multiple options.
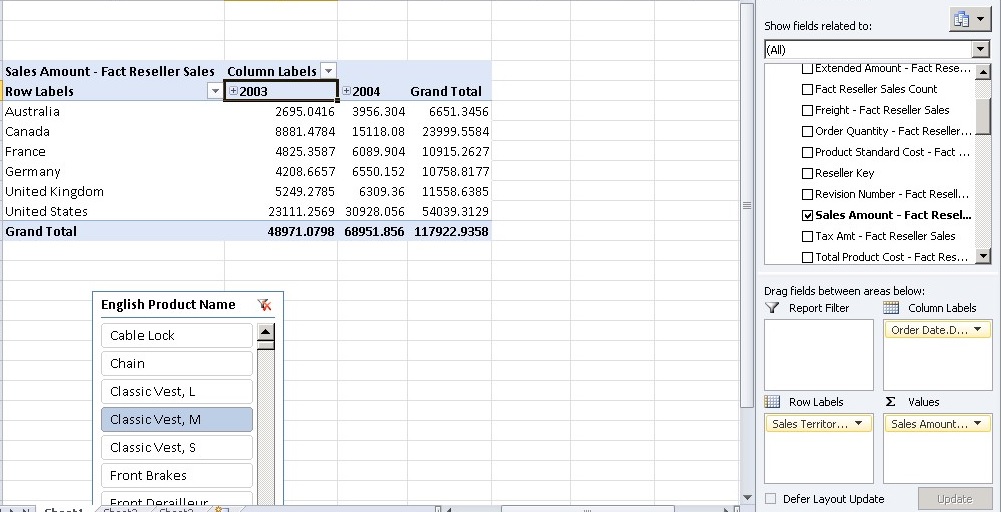
This is the example of Self Service Reporting where end user is creating the report for itself by choosing the desired Measures and Dimensions.
See the related Post
How to create cube files for offline use using Excel
Want to Learn MDX in 10 US Dollars. Please click here to get discount coupon
6 thoughts on “Self Service Reporting in excel from SQL Server Analysis Services (SSAS) using Pivot Table”
Vikas, since pivot tables and slicers, etc are all available regardless of source, what advantages do you get by using SSAS cube as your source, if any? Also have you tried pivot table against SSAS tabular cube? Thanks, Gary
Yes Pivot tables can be used with other data sources.But advantage is that in SSAS preaggregated data can be stored so the output will be instant and output will not be calculated at runtime and in self service reporting it will be very frustating if one doesn’t get the instant result.
SSAS Tabular Model has two modes 1)In-memory and 2) Direct Query. In-memory works fine with pivot table option in excel but Direct Query doesn’t work
Good post. I learn something new and challenging on blogs I stumbleupon on a daily basis.
It will always be helpful to read through articles from other authors and practice something from other websites.
Hi there, I desire to subscribe for this webpage to get hottest updates, so where can i do it please help.
I love reading through a post that can make people think.
Also, many thanks for allowing me to comment!
Hi there! I just would like to offer you a big
thumbs up for your excellent information you have here on this post.