
In this post i will explain you how to use multiple datasets in a single table in SSRS.
The same method can be applied on matrix,charts etc.
Although in SSRS you can use fields of only one dataset but you can use the aggregated value of the another dataset if the field in the another dataset is numeric.
This i will show you with the help of a demonstration
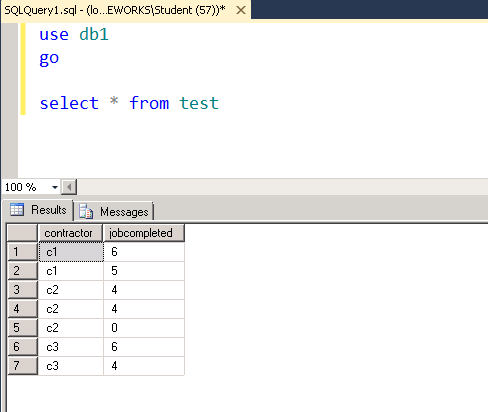
Let us consider a table as shown below which has details of contractors and the jobcompleted details
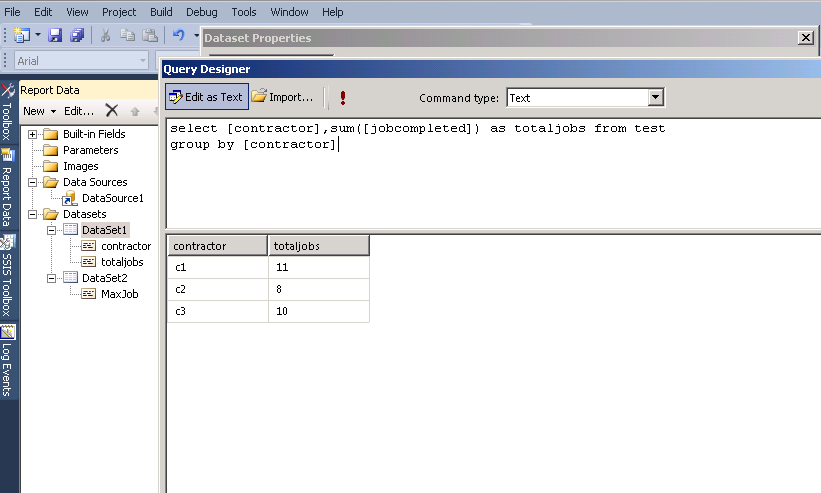
Now i have created a dataset named DataSet1 which has aggregated data representing total number of jobs by each contractor as shown below.
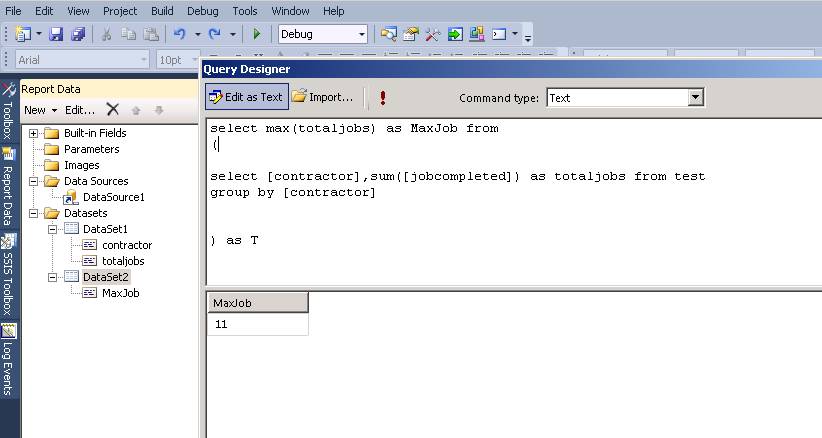
I have also created Dataset2 representing the Maximum number of jobs among all the contractors as shown below.
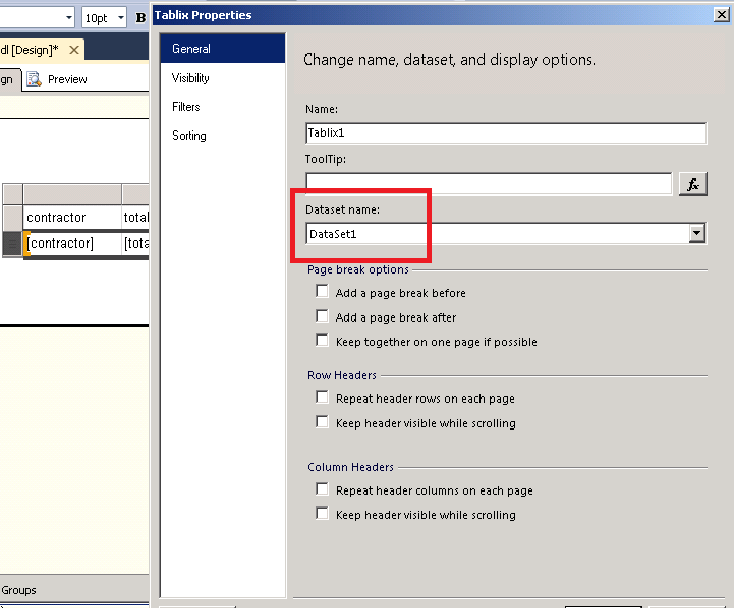
Now right click on the Table and go to the Tablix Properties
as shown below

Under Tablix Properties , General Tab you will find Tablix is bound with Dataset1. It means only the fields of DataSet1 can be used within this Tablix report as shown below.
Right click below the MaxJobComplete column and go to expression as shown below.

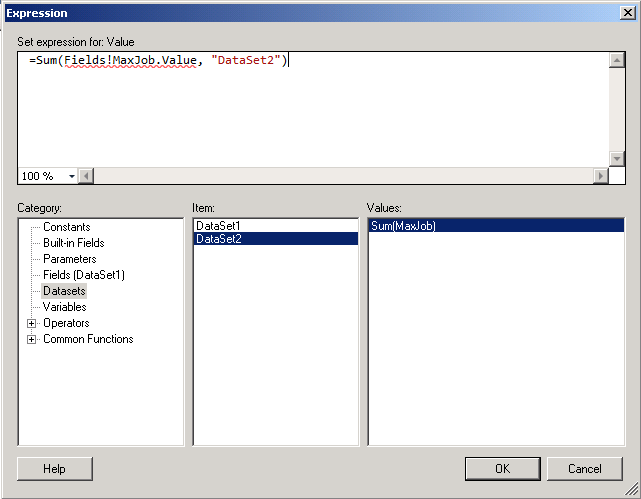
Under Expression , click Dataset then DataSet2 and double click Sum(MaxJob) as shown below.
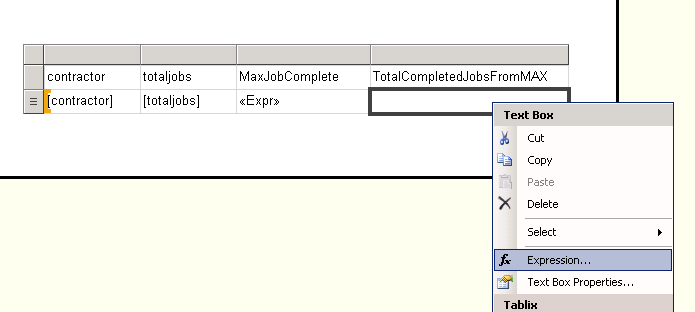
Right click below the TotalCompletedJobFromMAX column and go to expression as shown below.
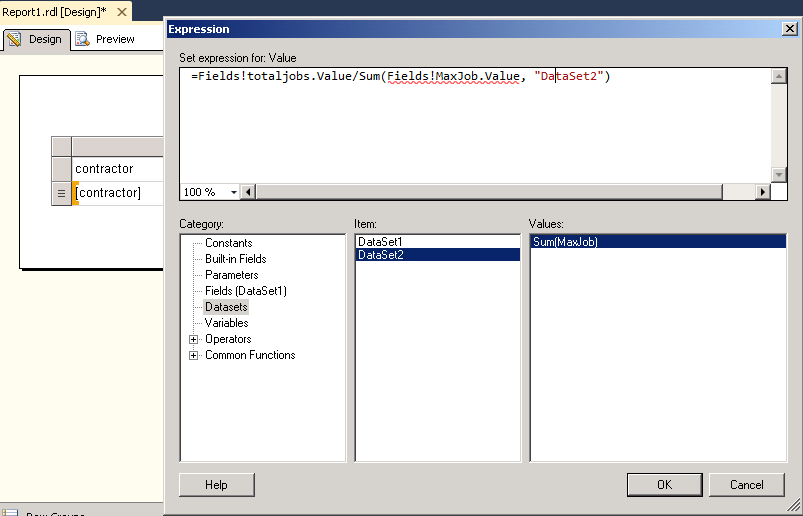
Under the Expression write the expression as shown below.In this expression i have used the fields from DataSet1 as well as DataSet2.
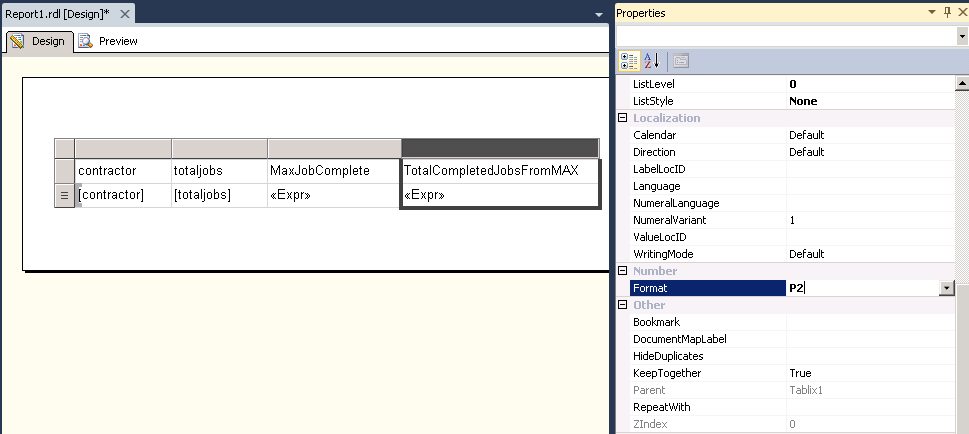
Now select the last column and go to the properties window and change the Format option to P2 as shown below. (P2 represents Percentage with 2 decimal places)
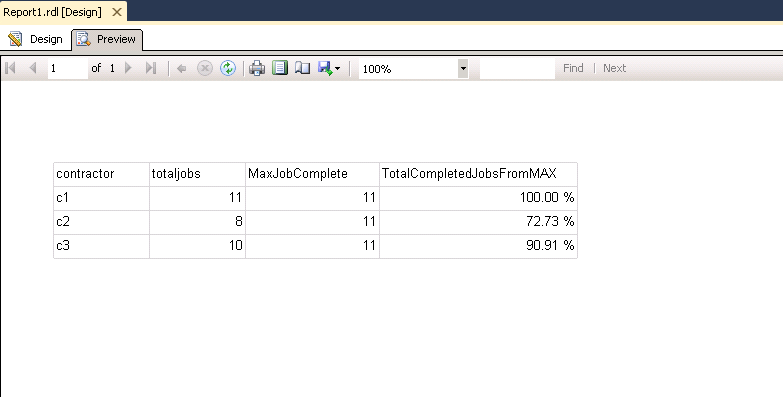
Now go to Preview tab and see the result as shown in the image below
2 thoughts on “How to use multiple datasets in a single table in SSRS”
Very in-depth post on using multiple datasets.
I particularly like the way you have explained the things step-by-step with screenshots 🙂
Keep up the good work!!
Thanks Neeraj for liking the post